
From Spreadsheet Bottlenecks to Reliable Dashboard Data
- Status
- Completed
- Confidentiality
- Anonymized. Anonymized professional case study. I've withheld company, client, field, dashboard, and business-rule names but kept public technology names and approximate scale figures.
Replaced a multi-day spreadsheet workflow with a reproducible Python pipeline that prepared four dashboard sources in under an hour.
I designed a Python and pandas workflow for recurring operational data preparation at approximately 200,000 source rows and more than 200 columns. It standardized transformation, reshaped data into roughly 3–4 million analysis-ready rows, and produced four coordinated BigQuery-backed dashboard sources. Employer-specific details are replaced with synthetic artifacts.
- Type
- Professional
- Categories
- Data & Dashboards
- Software & Automation
- Technologies
- Python
- pandas
- BigQuery
- Excel
Context
Teams responsible for recurring operational reporting and dashboard refreshes.
- Production data, code, schemas, screenshots, and business rules cannot be published.
- Existing dashboard outputs had to remain usable while preparation changed underneath them.
- Review and reconciliation remained part of the delivery cycle.
Problem
A wide, high-volume reporting workflow depended on fragile manual spreadsheet steps, making preparation, review, and coordinated dashboard refreshes slow and difficult to reproduce.
My contribution
I designed and implemented source normalization, joins, calculated transformations, wide-to-long reshaping, output generation, and review-oriented checks in Python and pandas. I prepared the long-form dataset for BigQuery-backed reporting and coordinated four dashboard-ready outputs.
Approach
Normalize and validate incoming files, perform repeatable joins and transformations, reshape wide measures into an analysis-ready long form, publish coordinated dashboard sources, and retain reconciliation inside the automated cycle.
Artifacts
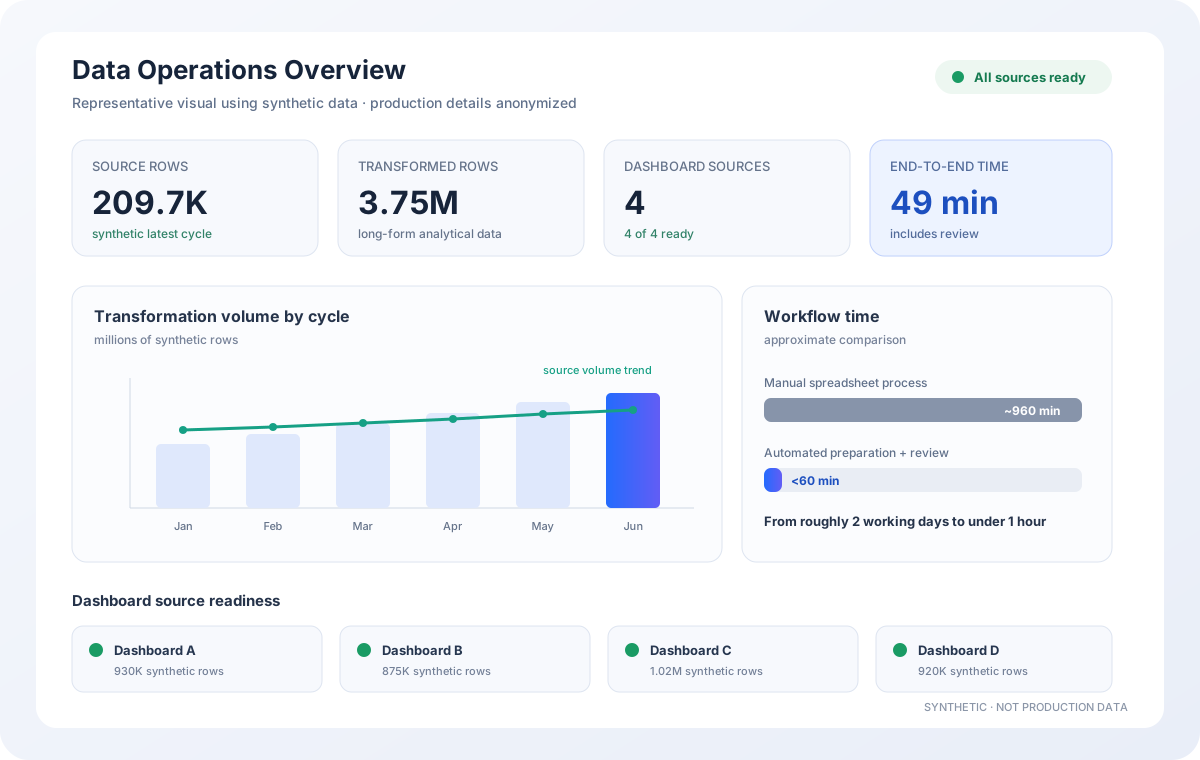
Representative dashboard overview (Chart) Representative visual using synthetic data Open full-size visual: Representative dashboard overview 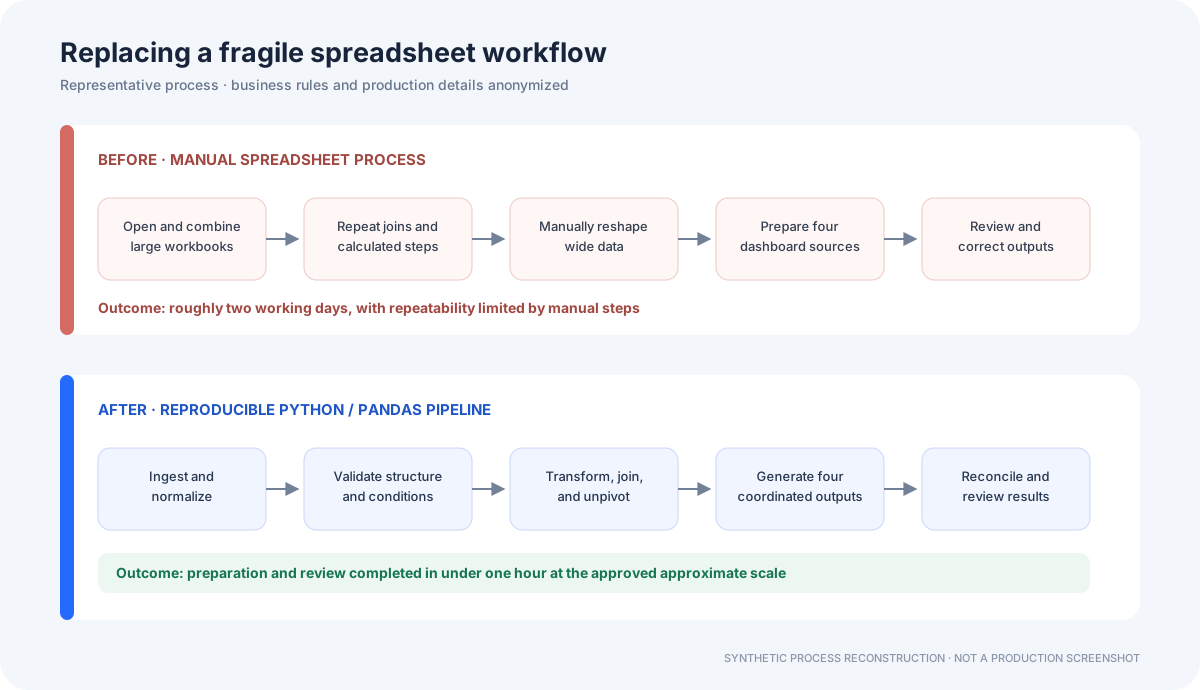
Before-and-after workflow (Diagram) Representative visual using synthetic data Open full-size visual: Before-and-after workflow 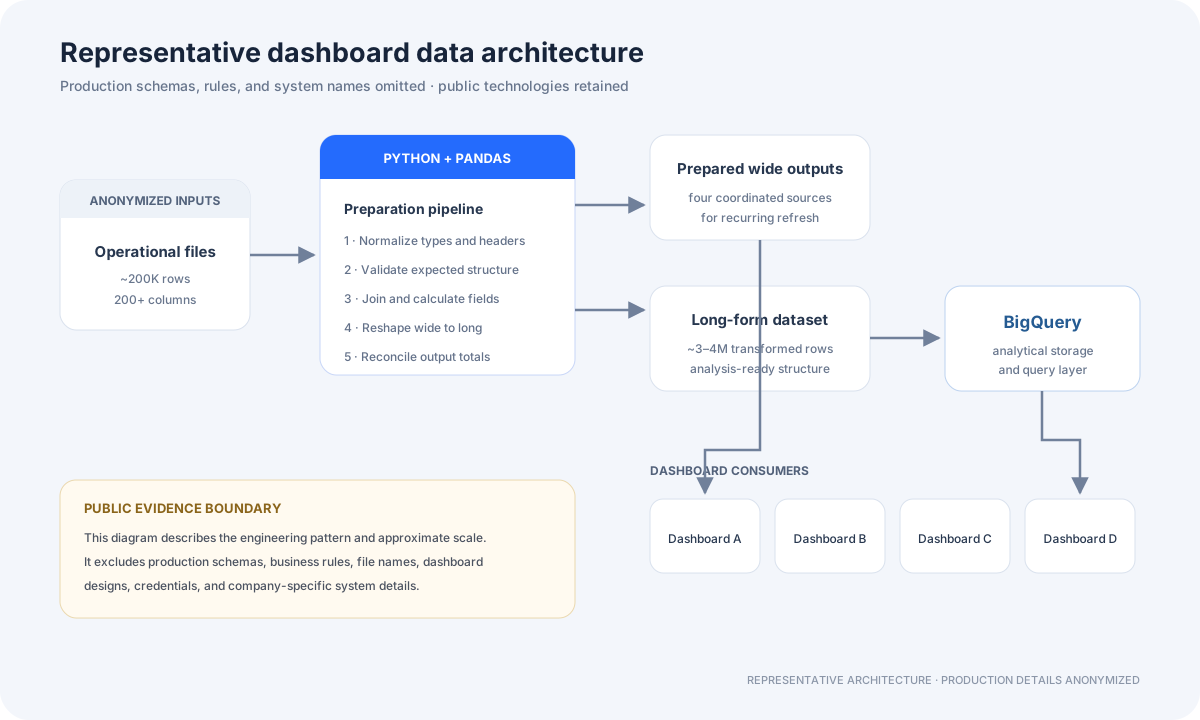
Data architecture (Diagram) Representative visual using synthetic data Open full-size visual: Data architecture
Data artifacts
- Open data artifact: Synthetic operations summary (JSON) Synthetic data
Outcomes
- Reduced approximate preparation and review time from two working days to under one hour.
- Handled approximately 200,000 source rows, more than 200 columns, and roughly 3–4 million transformed rows.
- Prepared four coordinated dashboard sources.
Limitations and current status
- I can't publish the source data or production implementation, so the results can't be independently reproduced in this public workspace.
- All published visuals and data are representative synthetic artifacts.